7 Steps to Automating Descriptive Statistics with Python
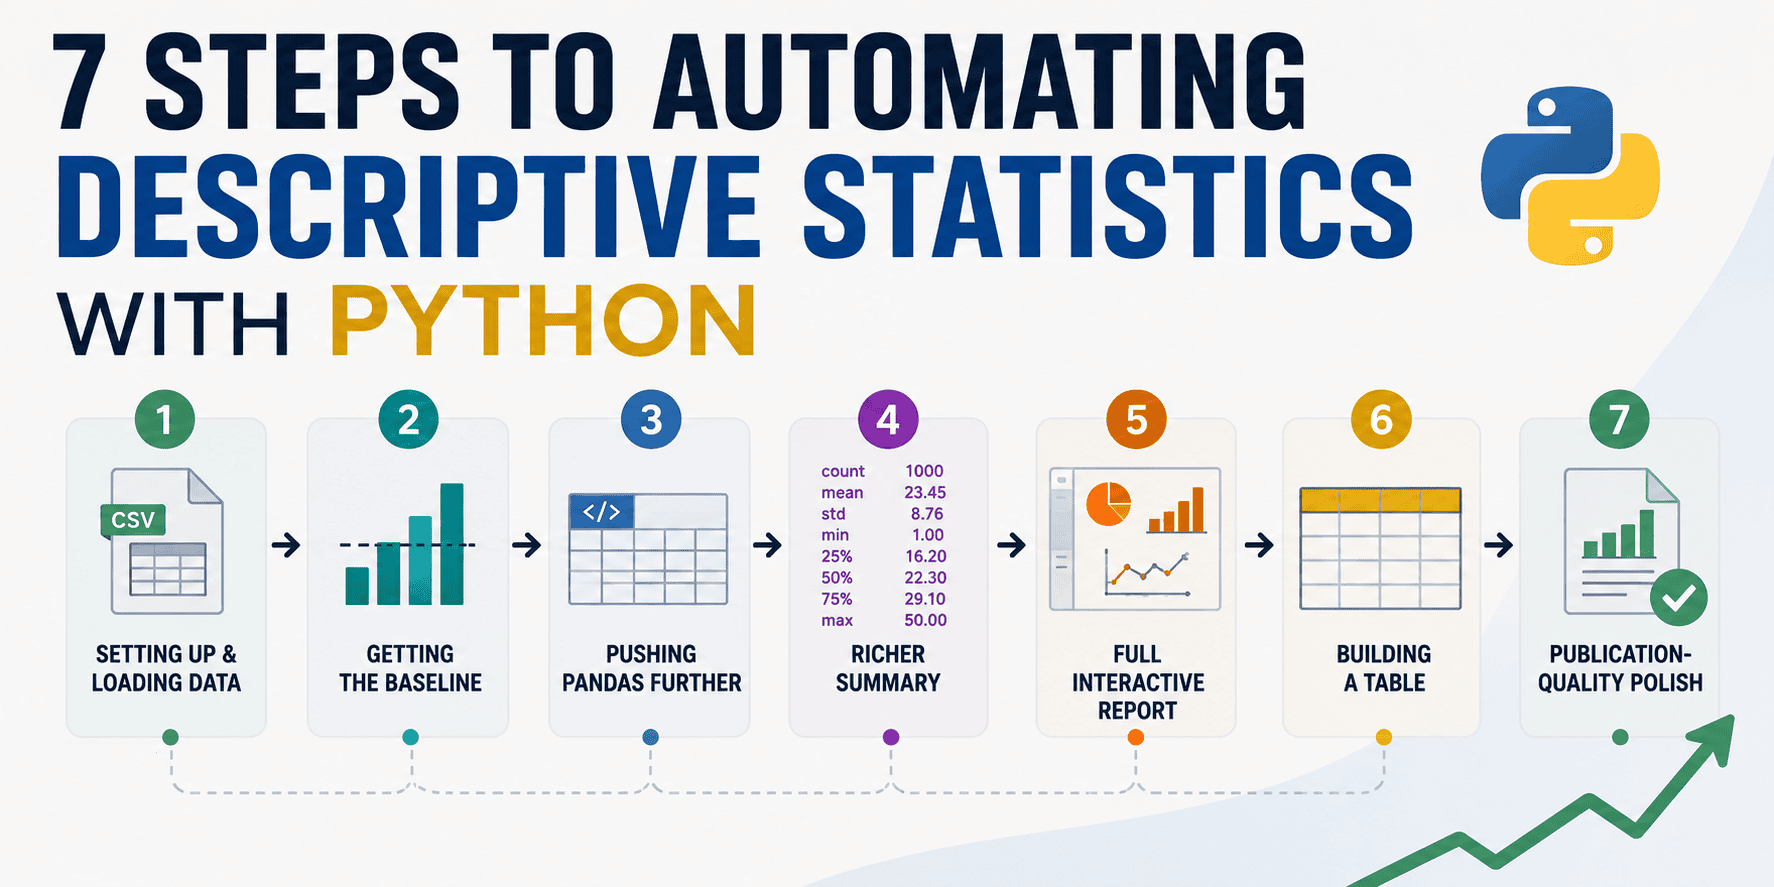
# Introduction Every analysis starts the same way: you load a dataset and try to figure out what's actually in it. How many rows? Which columns are numeric? How much is missing? Is anything wildly skewed? Most of us answer those questions by copy-pasting the same df.describe(),...
# Introduction Every analysis starts the same way: you load a dataset and try to figure out what's actually in it. How many rows? Which columns are numeric? How much is missing? Is anything wildly skewed? Most of us answer those questions by copy-pasting the same df.describe(), df.isna().sum(), and df.groupby(...).agg(...) snippets we've typed a thousand times, then reformatting the output by hand when it's time to drop it into a report.